Taxes are an important part of keeping a country running, funding all sorts of social and economic activities that improve and support our lives. There are a wide variety of taxes that the government collects from both individuals and businesses, ranging from VAT and corporation tax to National Insurance and stamp duty. However, as with many monetary matters, taxes can be a confusing topic and the help of legal experts is often required to gain a full understanding of your tax obligations.
How these taxes affect our lives can also be difficult to envisage, with government spending going to so many different projects and initiatives up and down the country. You might often wonder where all the money goes, what it’s spent on, and where. After all, it’s your hard-earned money, so seeing where it is making a difference is a great way of reassuring yourself that your tax contributions are not being squandered.
To try and shed some light on the UK tax landscape, we’ve done a little digging to uncover how much each part of the country contributes in taxes, and how much funding goes to the different regions. We’ve also taken a deeper look at the different ways in which our money is spent, as well as how much each region pays across a plethora of individual taxes.
So, read on for a breakdown of UK taxes without getting lost in the financial mumbo jumbo.
Fiscal balance by region
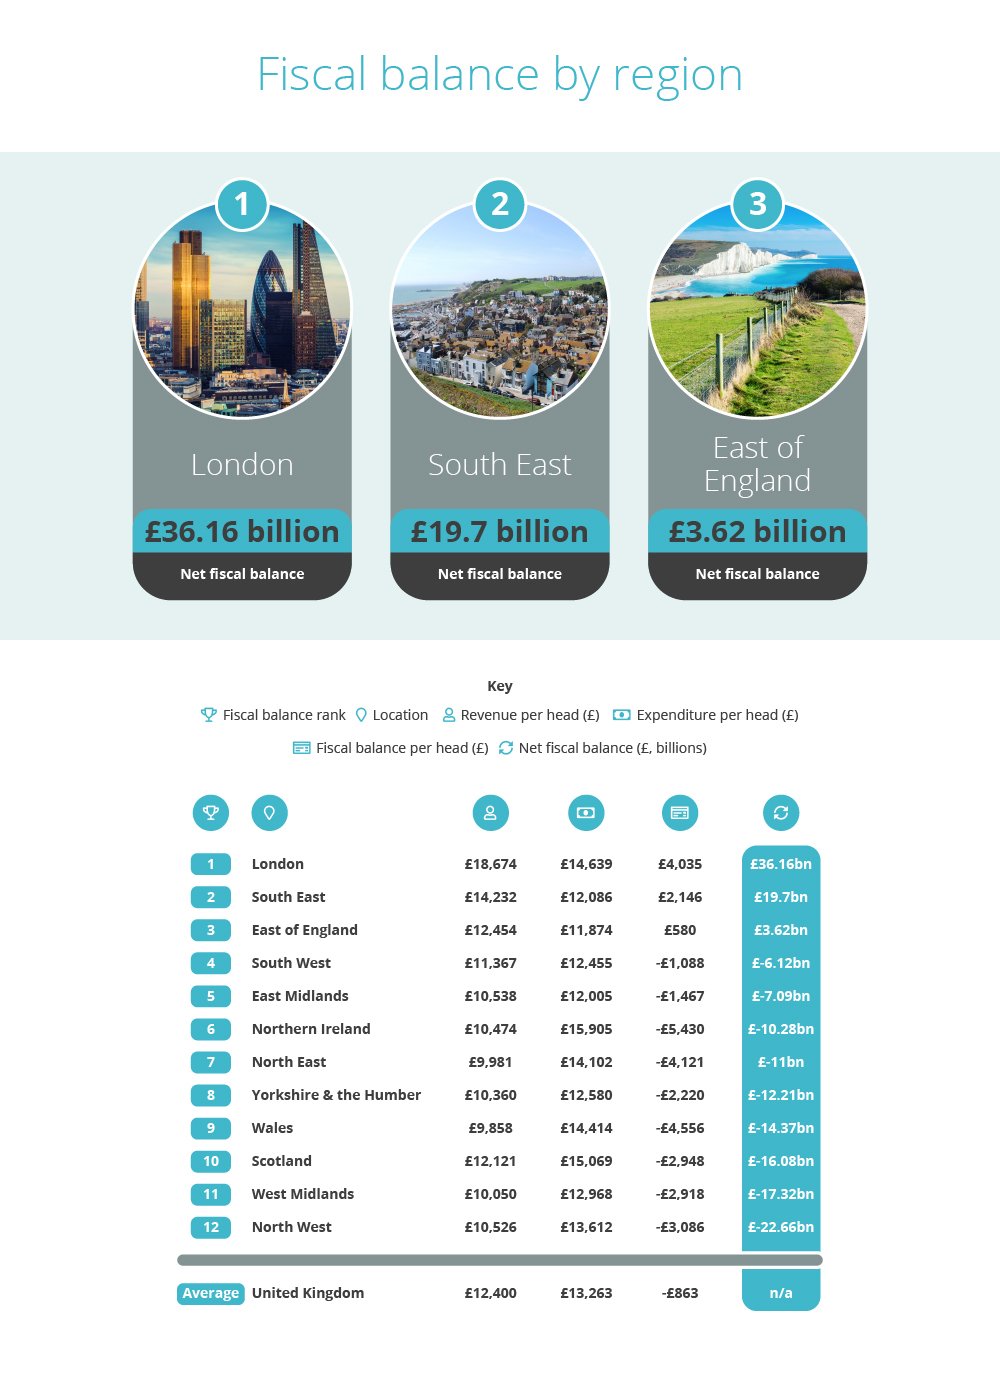
Fiscal balance is a measure of how much money a government collects in tax revenue and asset sales compared to how much they spend. A positive fiscal balance means that the government is collecting more revenue than they are spending, while a negative balance indicates the opposite. This is also referred to as government budget balance.
We’ve broken down the data to reveal which regions in the UK have the best fiscal balance. By looking at the total revenue and expenditure figures in each area, we can rank each region, showing which regions put in more money in taxes than they receive in investments.
London
Net Fiscal Balance: £36.16 billion
London comes top of the table, with a positive fiscal balance of £36.16 billion, which translates to £4,035 per head. As the country’s largest business hub, the capital city is home to a huge number of businesses all of which pay their share of taxes. As the largest city in the country by a long way, London is also able to achieve much greater economies of scale, allowing its spending to be carried out much more efficiently than in more sparsely populated areas.
South East
Net Fiscal Balance: £19.7 billion
The South East is the region with the second-best fiscal balance of £19.7 billion, which converts to £2,416 per person. The South East benefits from its proximity to London, with commutes between the two areas being popular for their short length, meaning that many people who work in well-paid jobs in London are able to escape the urban sprawl by living in the South East, where they will pay their personal taxes. Being so close to Europe also makes the South East a key part of the UK’s trade network, increasing the amount of business that passes through the region.
East of England
Net Fiscal Balance: £3.62 billion
The East of England has the third-best fiscal balance in the country of £3.62 billion or £580 per head. This region also benefits from easy access to London from the more southerly counties of Hertfordshire and Essex, which allow people to commute into London while not actually living in the capital. There are many strong industries in the East of England, including agriculture in East Anglia and tech in Cambridge, which contribute to the positive fiscal balance that the region enjoys.
It is worth noting that no other part of the UK, whether a constituent country or English region, has a positive net fiscal balance. This indicates that the British economy has developed to centre on London and its surrounding areas, while other parts of the country lag behind to varying extents.
Revenue by region
Here, we focus purely on the tax revenue brought in by each region, breaking it down into several income streams. This allows us to see how the balance of tax income varies from region to region, adding context to the tax revenue figures for each area.
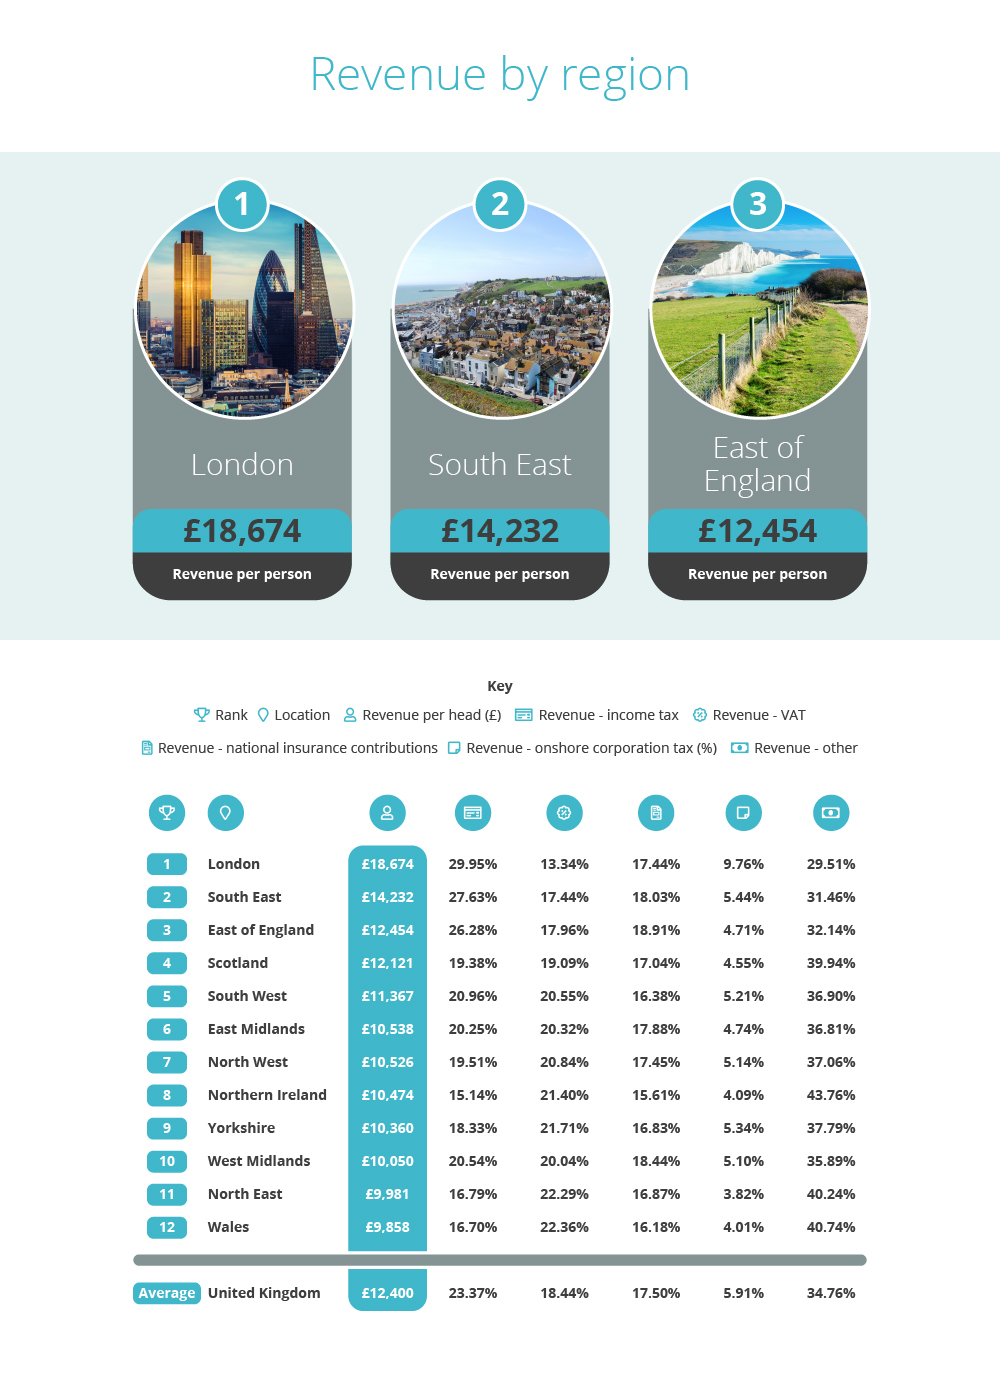
Again, the three regions with the highest revenue per head are London, the South East, and the East of England. However, each region’s revenue is balanced slightly differently.
Income Tax
The region whose revenue has the largest proportion of income tax is London, where it makes up 29.95% of the total revenue of the area. Income tax makes up the smallest amount of the total tax revenue in Northern Ireland, at just 15.14%.
VAT
Value-added tax (VAT) is the largest revenue stream in Wales where it makes up almost a quarter of the country’s tax revenue at 22.36%, which is almost 4% higher than the UK national average. VAT makes up the smaller amount of revenue in London, where it accounts for only 13.34% of tax earnings.
National Insurance
Taxes in the East of England have the largest proportion of National Insurance revenue out of any of the regions at 18.91%, while it makes up the smallest percentage (15.61%) of revenue in Northern Ireland.
Corporation Tax
Corporation tax (on-shore, excluding North Sea oil and gas) makes up a considerable 9.76% of tax revenue in London, which is 4.32% higher than the region with the second-highest proportion, the South East. This proportion is so high that London is the only region whose quota of corporation tax is higher than the UK national average, which is 5.91%. This illustrates just how much of a business hub London is when compared to other parts of the country.
Expenditure by region
Having looked at where the government gets its money, we now turn our attention to the ways in which it spends it.
Northern Ireland
Expenditure per Head: £15,905
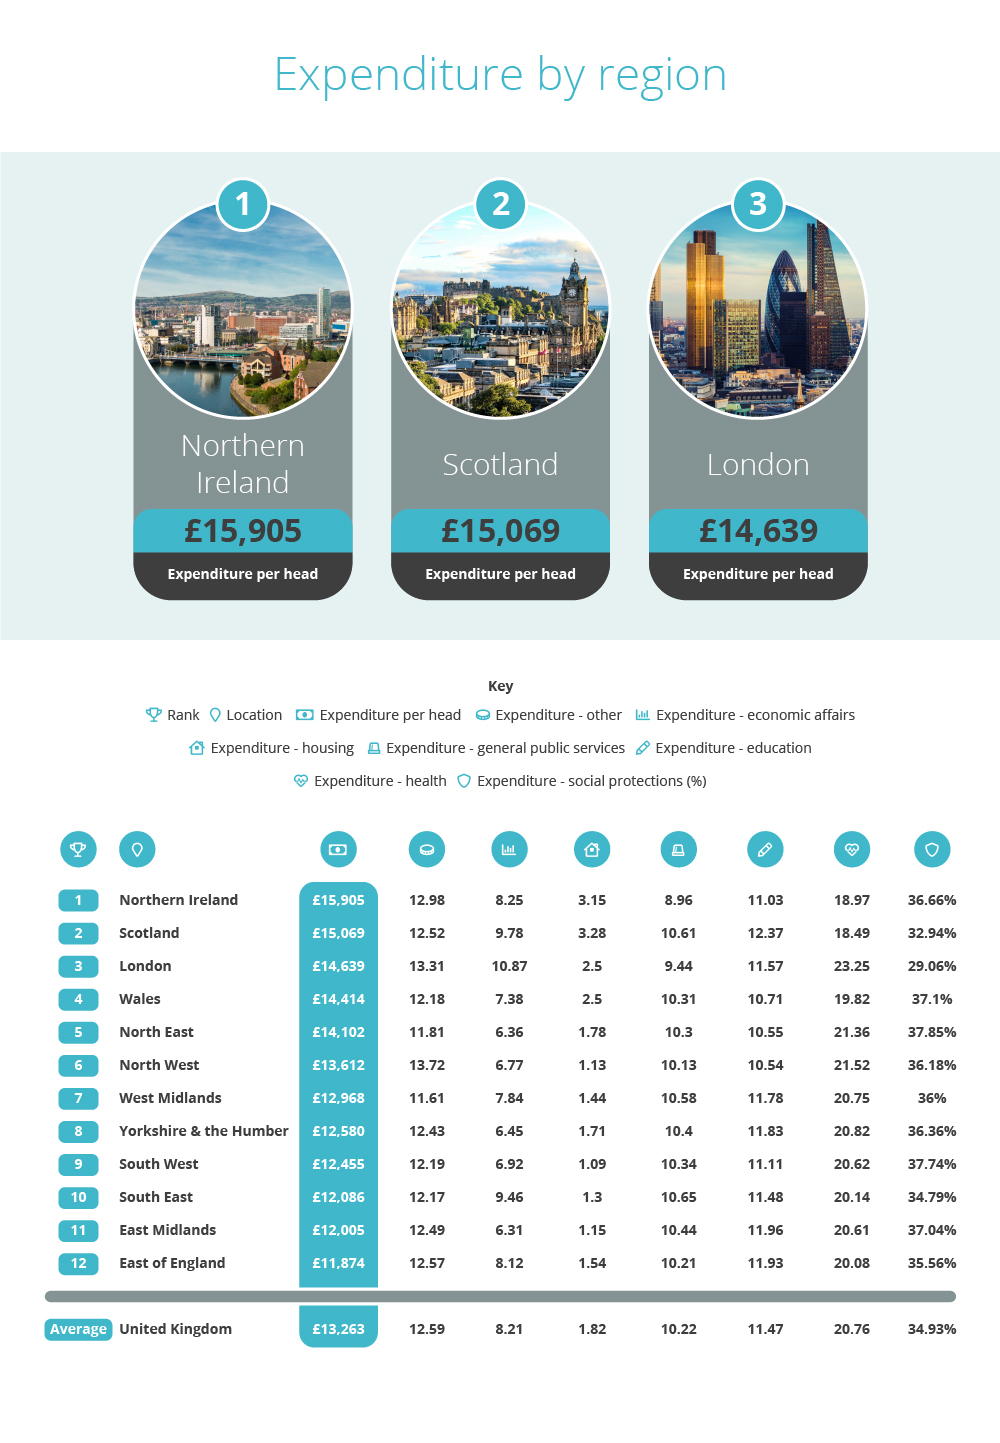
Northern Ireland has the highest level of expenditure per head in the UK, with £15,905 being spent per person. As with every region, social protection takes up the biggest proportion of expenditure, totalling 36.66% in Northern Ireland. The region also has a relatively high percentage of its expenditure (3.15%) going towards social housing, with the national average being only 1.82%.
Scotland
Expenditure per Head: £15,069
Scotland has the second-highest level of spending per head, receiving £15,069 per person. Scotland spends the largest proportion of expenditure of any region on both education and social housing. However, the amounts spent on health and social protection are lower than the UK national average.
London
Expenditure per Head: £14,639
London has the third-highest level of public expenditure per head, spending £14,639 per person. Much of London’s spending goes towards health and economic affairs, with it putting more money into these areas than any other region.
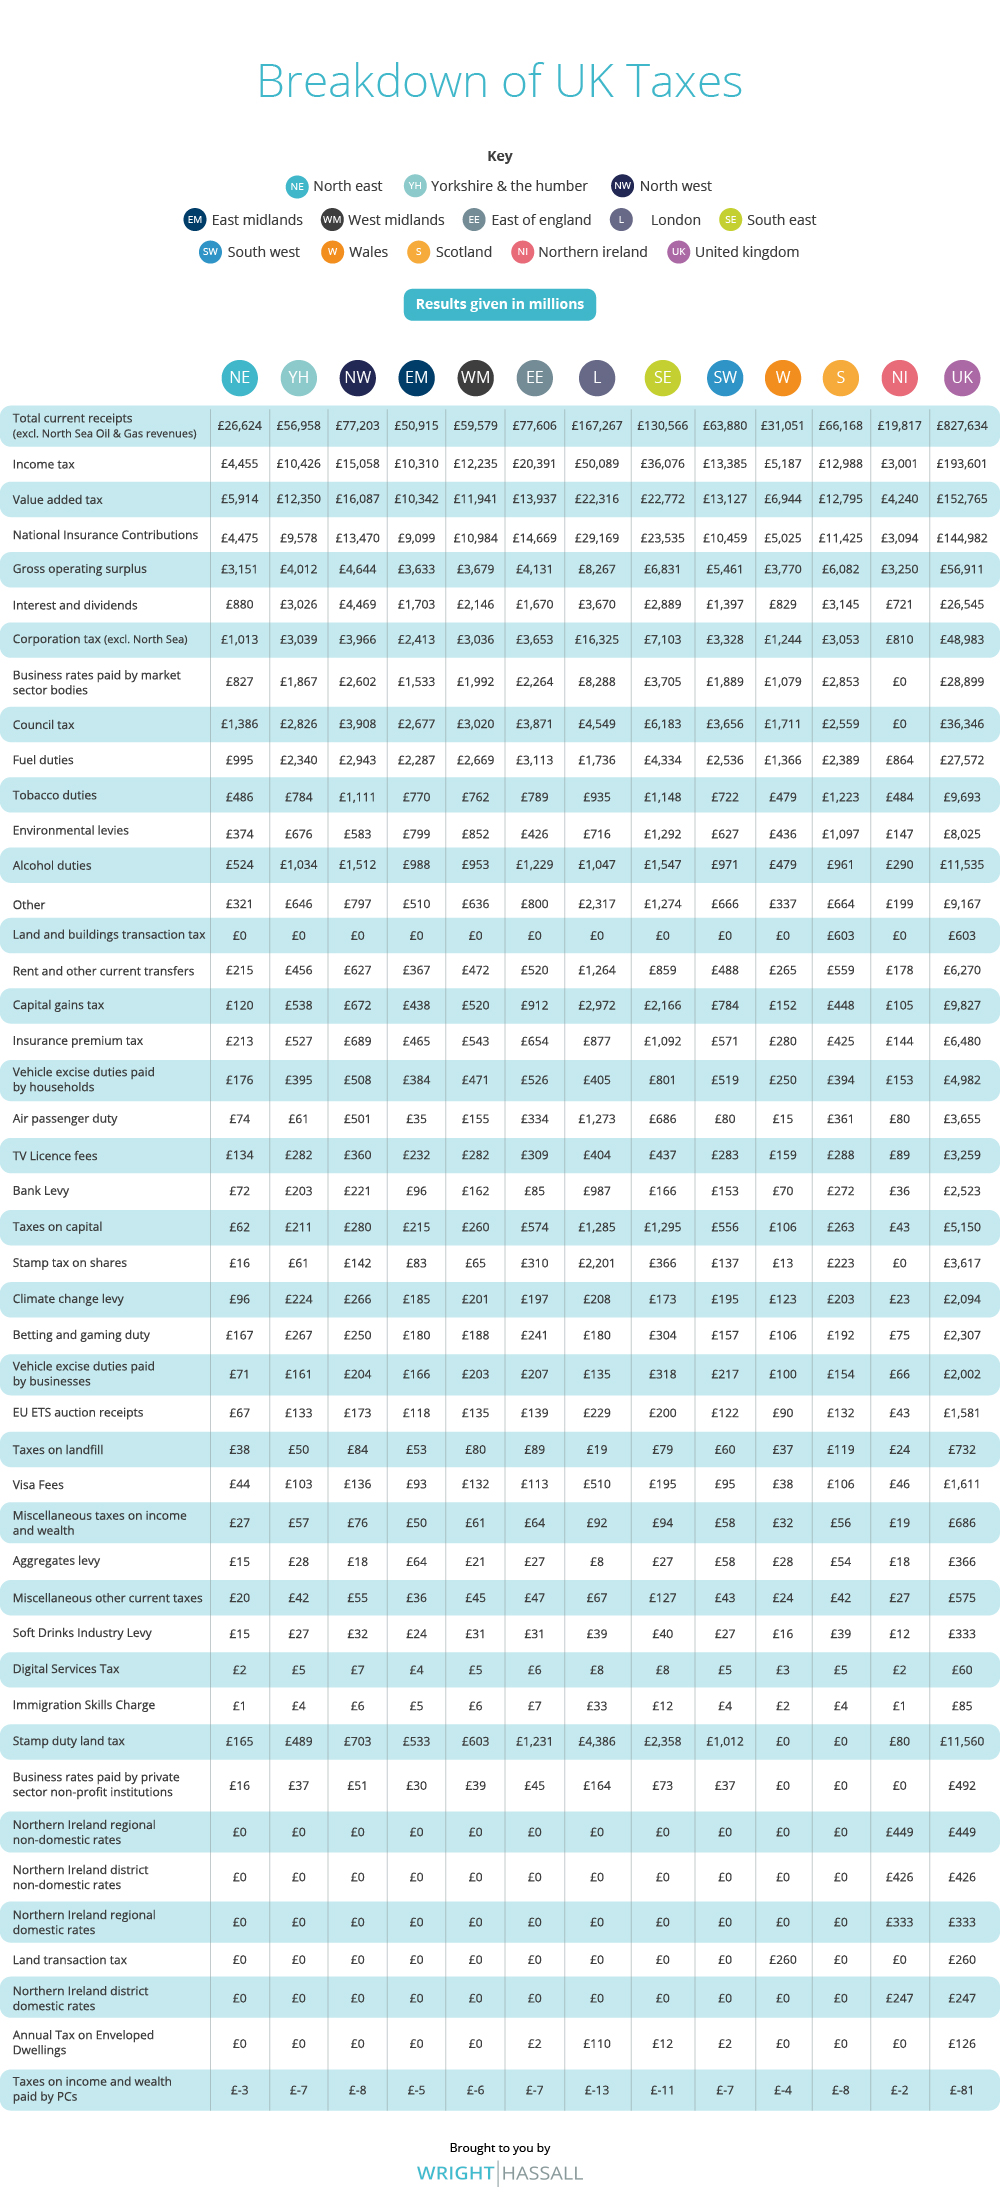
Breakdown of UK Taxes
Here, you can see a full breakdown of different taxes across all regions and constituent countries of the UK. The amount each region pays towards each tax can vary greatly, with some parts of the country contributing more through different revenue streams.
For example, Scotland pays the most in tobacco duties (£1.223 billion), while the South East pays the most in alcohol duties (£1.547 billion), and the North West contributes the most through the climate change levy (£266 million).

